
Industry Research: Where America’s Demographics are Changing
We offer custom industry research & competitive intelligence solutions. Below is a sampling of the types of data and insights we’re able to source, analyze, and deliver to clients.

Migration patterns are a constant area of interest and research. Where are people leaving, going, and staying?
This question has become even more interesting over the past few years. For the people that weren’t anchored to a single place for a job, how did that change where they wanted to live?
Communities can change by size (grow or shrink) or composition (different people move in than live there already).
It’s important to understand both of these components - migration patterns overall, and also the migration patterns that are driving changes to communities.
Where are the places that have incoming migrants with different age, income, or expectations than the people living there today?
Building on that, how does growth impact where it makes sense for brands to expand?
Migration Patterns: The Big Picture
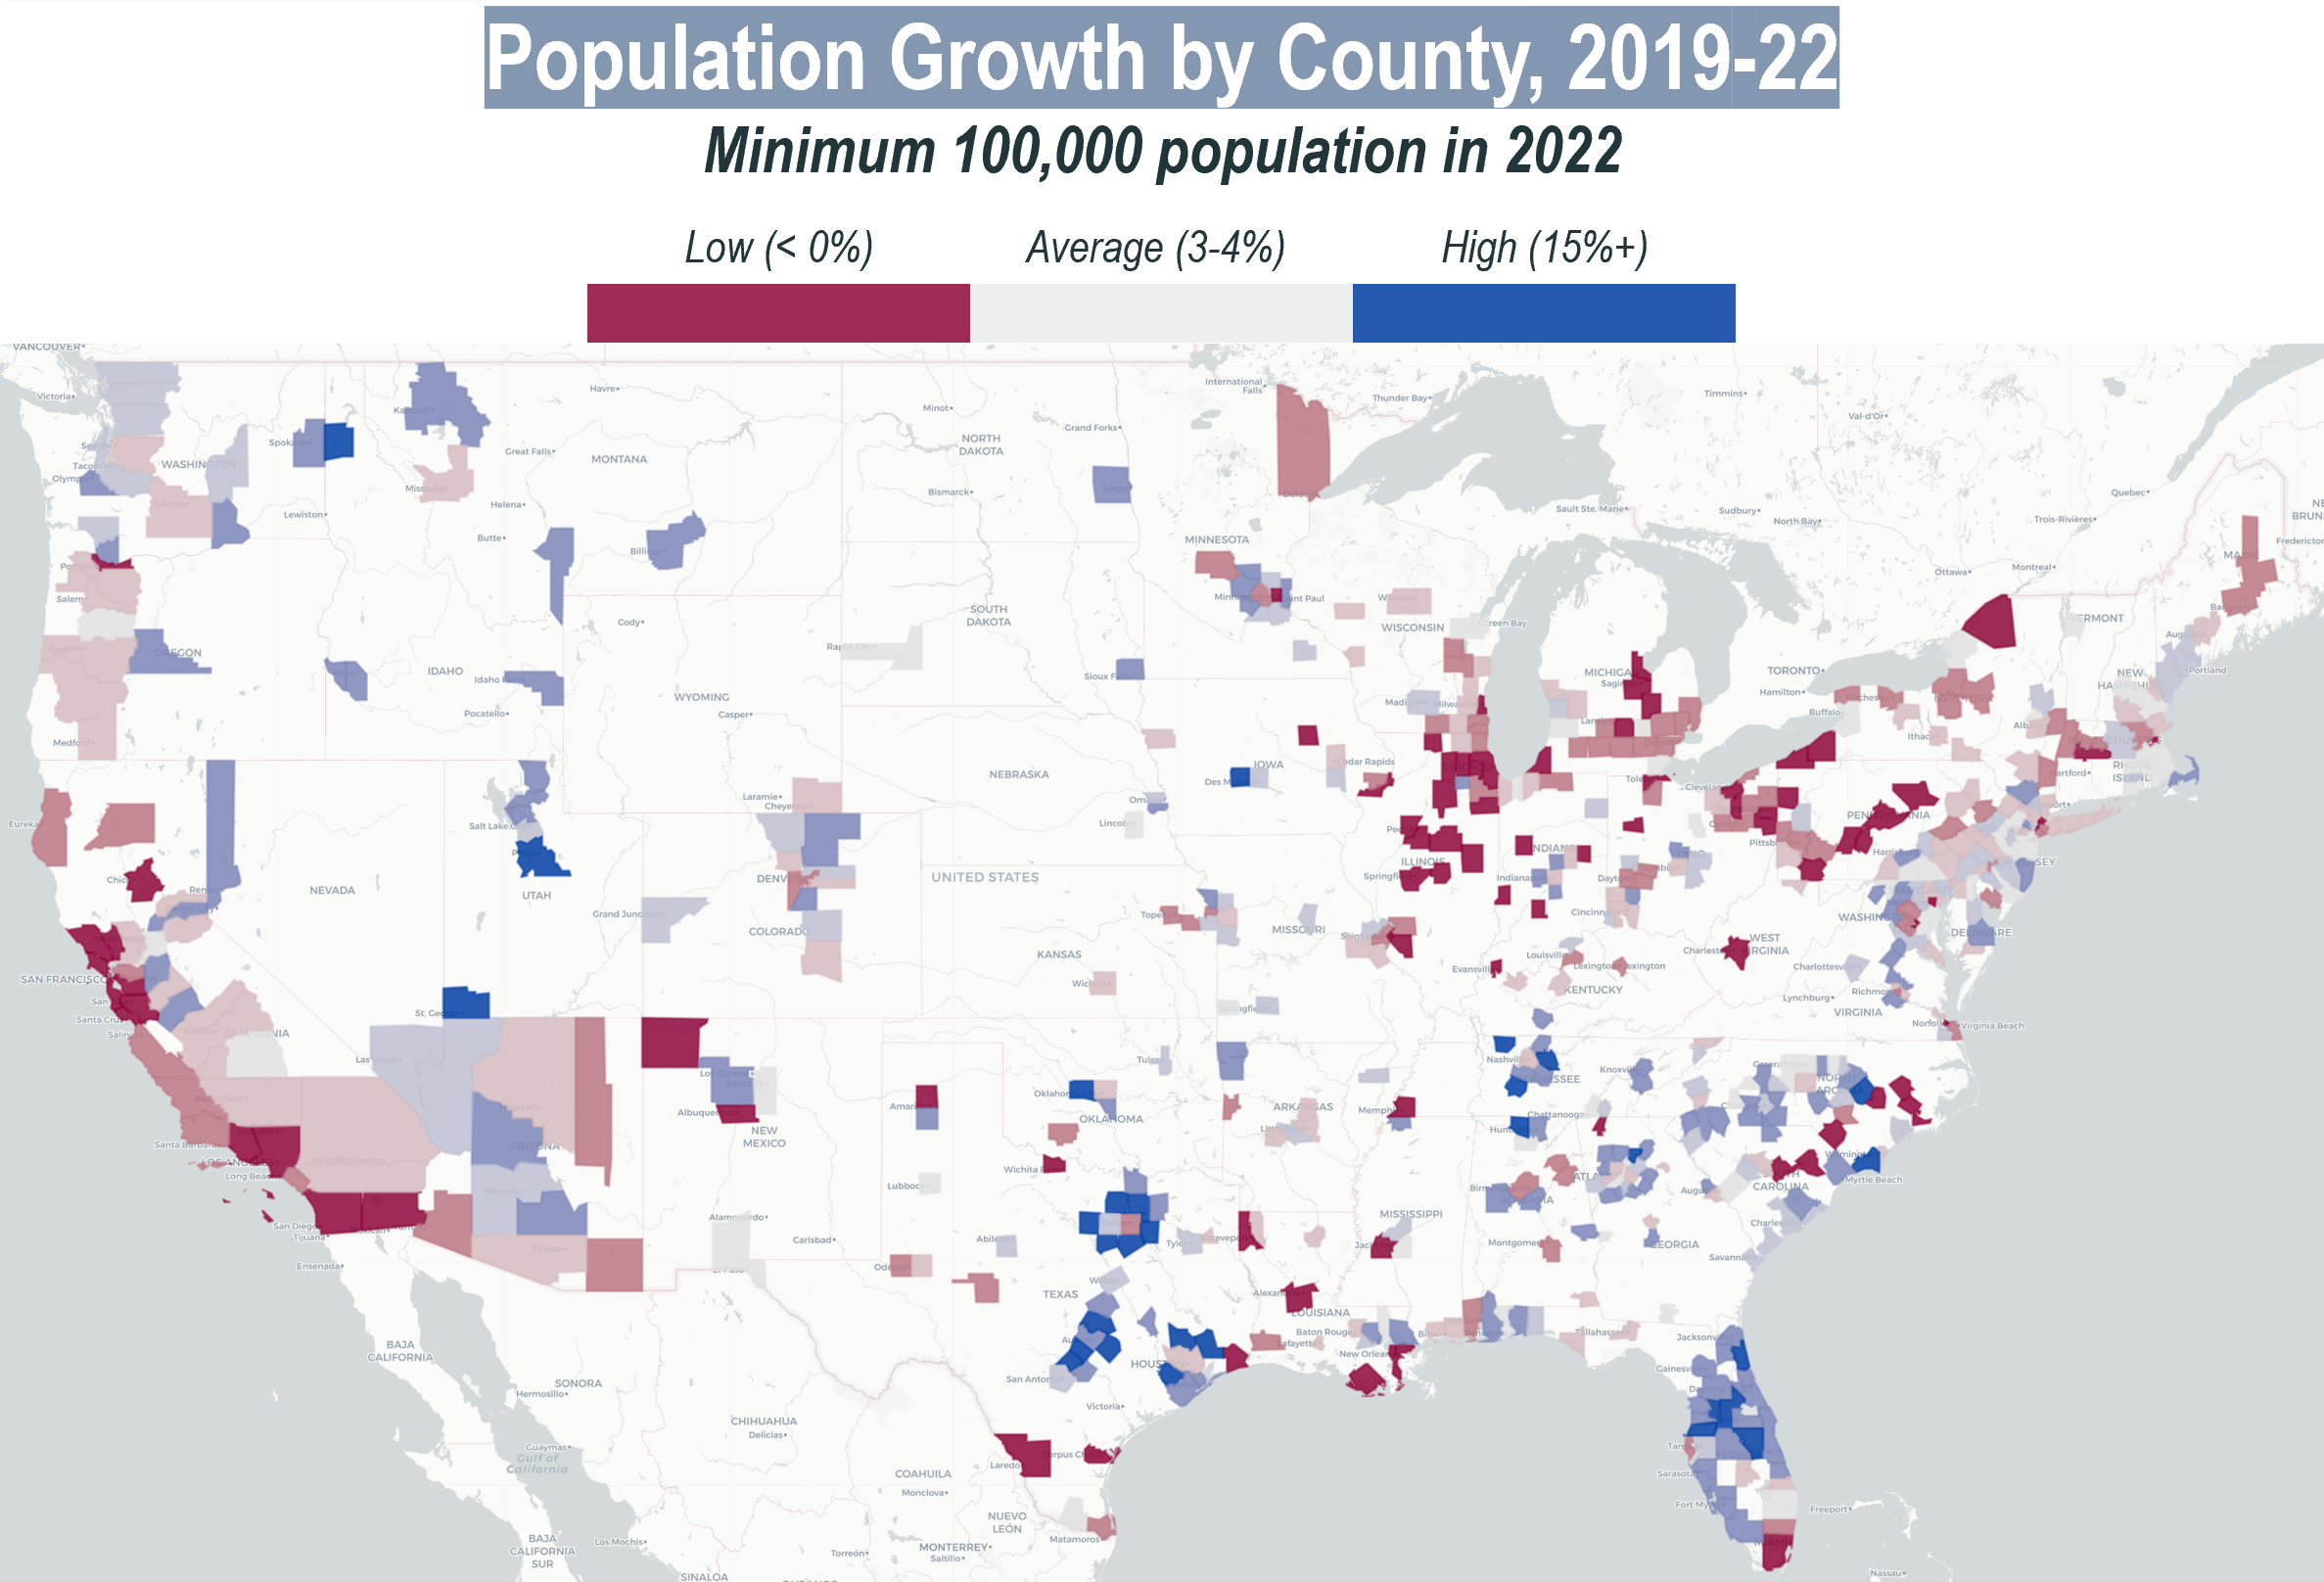
Broadly speaking, since 2019 the population have left California and Northeast / Midwest urban areas. A few counties of note that had a declining population are:
San Francisco County: -8%
Suffolk County (Boston): -4%
Cook County (Chicago): -2%
New York County: -2%
The biggest beneficiaries have been Texas and Florida. Of the 10 fastest growing counties with at least 100,000 population, 8 are in Texas.

One question we find interesting is which migration patterns were temporary and which will remain permanent.
Consider an area like Ada County, Idaho, home to Boise. Census data shows that the population has increased 13.6% since 2019 from 457,000 to 519,000.
Data from mobility provider Unacast shows that much of this growth was concentrated in “Early COVID” and might not have long-term staying power.

Screenshot from Unacast Insights platform for Ada County, Idaho
Our belief is that communities that have a self-sustaining job opportunities - not opportunities that were enabled by remote work - will be the long-term beneficiaries of migration trends over the past couple years.
For example, contrast the first chart with another high-growth area, Wake County, NC (home to Raleigh). Here, Unacast’s data shows growth decelerating but remaining positive, suggesting a longer sustaining trend.
This area has ample and diverse job opportunity along with good year-round weather and (relatively) more affordable housing.

Migration patterns have a tendency to revert to their long-term trend and in recent quarters we’re seeing that reversion - more people moving back into cities and away from far-out rural counties.
However, that doesn’t change the “shock to the system” of COVID migration patterns. Many that left their places of residence may not be going back anytime soon.
This is changing the makeup and composition of some communities. When someone leaves San Francisco for Austin, TX, they might bring an income that’s higher than the local income or different entertainment preferences, driving changes to communities when this happens at scale.
America’s Changing Counties: Income
Areas can primarily change in one of two ways:
The number of people grows or shrinks
The people moving in have a different demographic composition than those who already live there
The first map covered growing and shrinking. Just as interesting to look at is the second - which areas are changing?
Consider the same map - counties with at least 100,000 population - visualized a different way.
Now we’re looking at the difference in adjusted gross income (AGI) between households that moved in and those that already lived in the county.
For example, a dark blue county means the income of households that moved in was at least 25% higher than households that already lived there (i.e., $125,000+ for incoming households and $100,000 for existing households).

There are a couple interesting findings for us here on counties shaded dark blue:
The state of Florida had both high in-migration, and also higher income households.
Most non-Florida counties with high income changes are “rural exoduses” away from urban hubs.
Las Vegas is among the only non-Florida major areas to be shaded dark blue
On the first point, Unacast data shows that between 2021-2022, the top origin state for movers to Florida was New York, many likely from New York City.
This would explain the income differences for incoming households. Bringing a New York City salary almost anywhere will be higher than the existing residents.

On the second, we found it interesting to look at places like Cape Cod, MA, Suffolk County, NY (the Hamptons), and Sonoma & Napa Counties in California.
These are traditionally thought of as vacation communities, but higher income households uprooted from cities to these communities, dramatically changing the income disparities between residents and migrants.
This was only possible due to COVID & remote work. Otherwise, the travel and commutes would have made these communities infeasible for long-term transit to an urban hub.
Will these households stay over the long-term? We don’t believe so.
America’s Changing Counties: Age
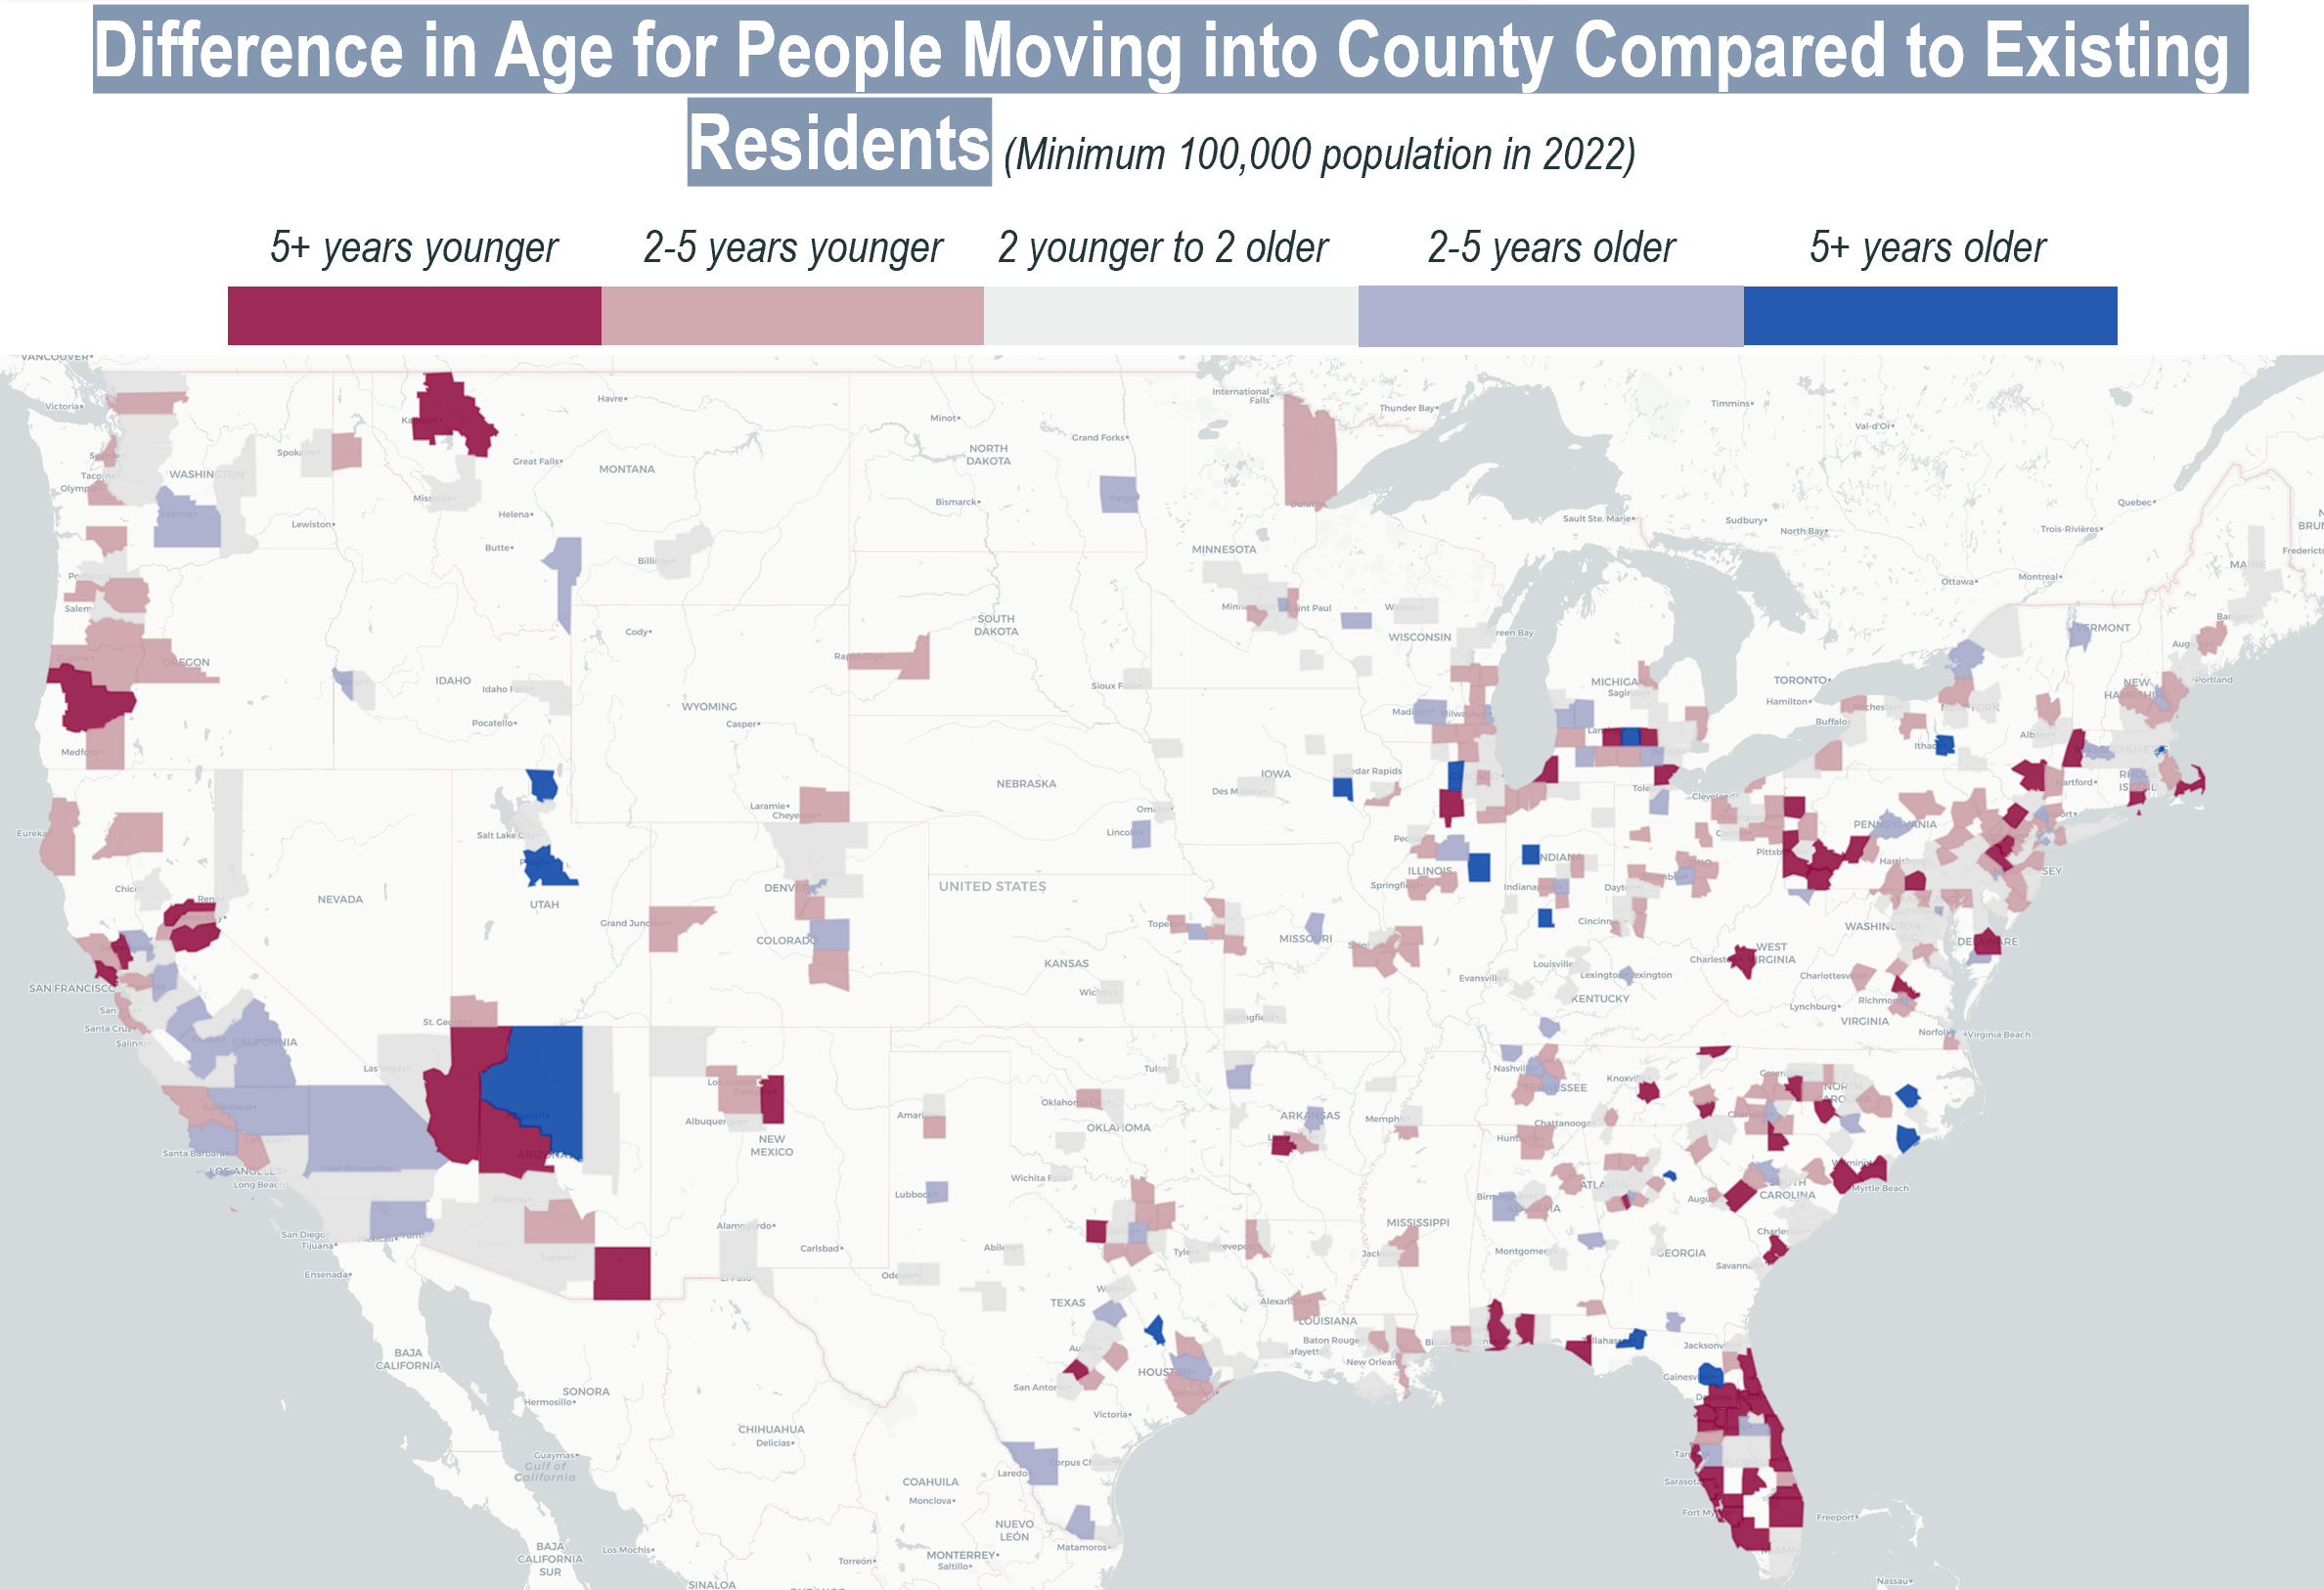
Let’s look at one last map - where the age of the people moving in is different than the age of the existing residents.
Here, we see that most areas are fairly similar to their existing population - this isn’t a surprise; the median age usually doesn’t change dramatically over time.
Data sourced from Unacast migration pattern
An analysis of Unacast migration data again shows much of Florida as an outlier. The state - most notably the coasts - are getting much younger.
Traditionally viewed as retirement communities, these areas are rapidly changing. Along the southwest coast, the average age of people that moved to the region was, in some counties, 10-20 years younger than existing residents, according to Unacast migration data.
Outside of Florida, urban cities are getting younger, which again is not unusual. Early career professionals move into cities and more experienced ones leave for the suburbs.
Bringing It All Together

Photo by Marc-Olivier Jodoin on Unsplash
Florida has received much attention for its population growth over the past few years, but this population growth isn’t the whole story. The state is also getting younger and wealthier.
Coastal Florida in particular was built around supporting the retirement community. Now, with more families and year-round residents, the variety and volume of supporting stores may have to shift.
Texas, on the other hand, is fast-growing but not experiencing as dramatic demographic changes.
Areas that were historically more seasonal or tourist-driven, like coastal or ski towns, saw a “shock to the system” with high in-migration of wealthy households. I’d expect these communities to gradually return to pre-COVID trends over time.
The long-term winners will likely be places that have sustainable employment hubs, better weather, and relatively lower cost of living - places like Charlotte & Raleigh, NC, Tampa, FL, Dallas-Fort Worth, TX, Atlanta, GA, and Nashville, TN.
Growing brands are taking notice of these emerging areas. For example, since 2021, 33% of Costco’s new locations have been in just 4 states that represent only ~20% of the population: Texas, Florida, Georgia, and North Carolina.
Growth and changing demographics create opportunities that previously might not have fit a brand’s target market.
Restaurant brands like sweetgreen and CAVA, previously in urban cores, have increasingly been viewing suburban areas a growth engine of the business - primarily because their target customer is moving there and where people work & spend time is changing.
One Last Finding

One final finding in Florida that I’m keeping my eye on is the behavior in Miami-Dade County. It’s a high-profile area and there’s been a lot of buzz about it as an emerging “new financial hub”, but the data doesn’t necessarily play that out.
The population actually declined by 1% between 2019-2022 and the age of people moving in isn’t materially different - this seems to run counter to the narrative that it’s emerging as the new buzzy Southeast city.
The dramatic difference is seen in the difference in income for existing and incoming households.
Households that moved into Miami-Dade County between tax years 2020-2021 had an average adjusted gross income of $229,000, nearly 3x higher than existing households.

Miami-Dade’s notoriety hasn’t necessarily been because the population has been fast-growing, it’s that the households moving there are very different than the households already living there.
What impact does this have on the community? Most notable is in the cost of housing. Redfin data shows that the median home price in the county increased from $299K to $520K from 2019-2023 YTD, an increase of 73% and well above the national benchmark.
Home prices are the most visible near term indicator of an area’s popularity and changing demographics. Over the longer term, additional supporting infrastructure like higher end brands, wealth management, and other signs of a changing population may also start to emerge if these trends hold.
Interested in this research or have topics of interest to your business? Reach out to us to discuss by email at jordan@bean.consulting or through our website.