
From Data to Insights: Leveraging Your Internal Location Data
Many businesses we talk to know there’s value sitting in their data but they haven’t yet found a way to extract that value. One place this is particularly relevant is companies that have location data that relates to their services.
This includes companies in industries like:
Home Services (HVAC, Plumbing, Home Repairs / Installs)
Recurring Home Deliveries (Food kits, Composting services)
eCommerce (Furniture, home goods, retail)
Through the nature of the services, these companies have a wealth of information that can be generated about where they’ve been successful and the customer profiles that can be built based on those areas.
Below are 3 ways businesses can leverage this data to drive insights for their business.
Generate Clear Insights on Where You Do Business
This first use is fairly straightforward. Data provides a clear picture of where you’re doing business and attracting customers.
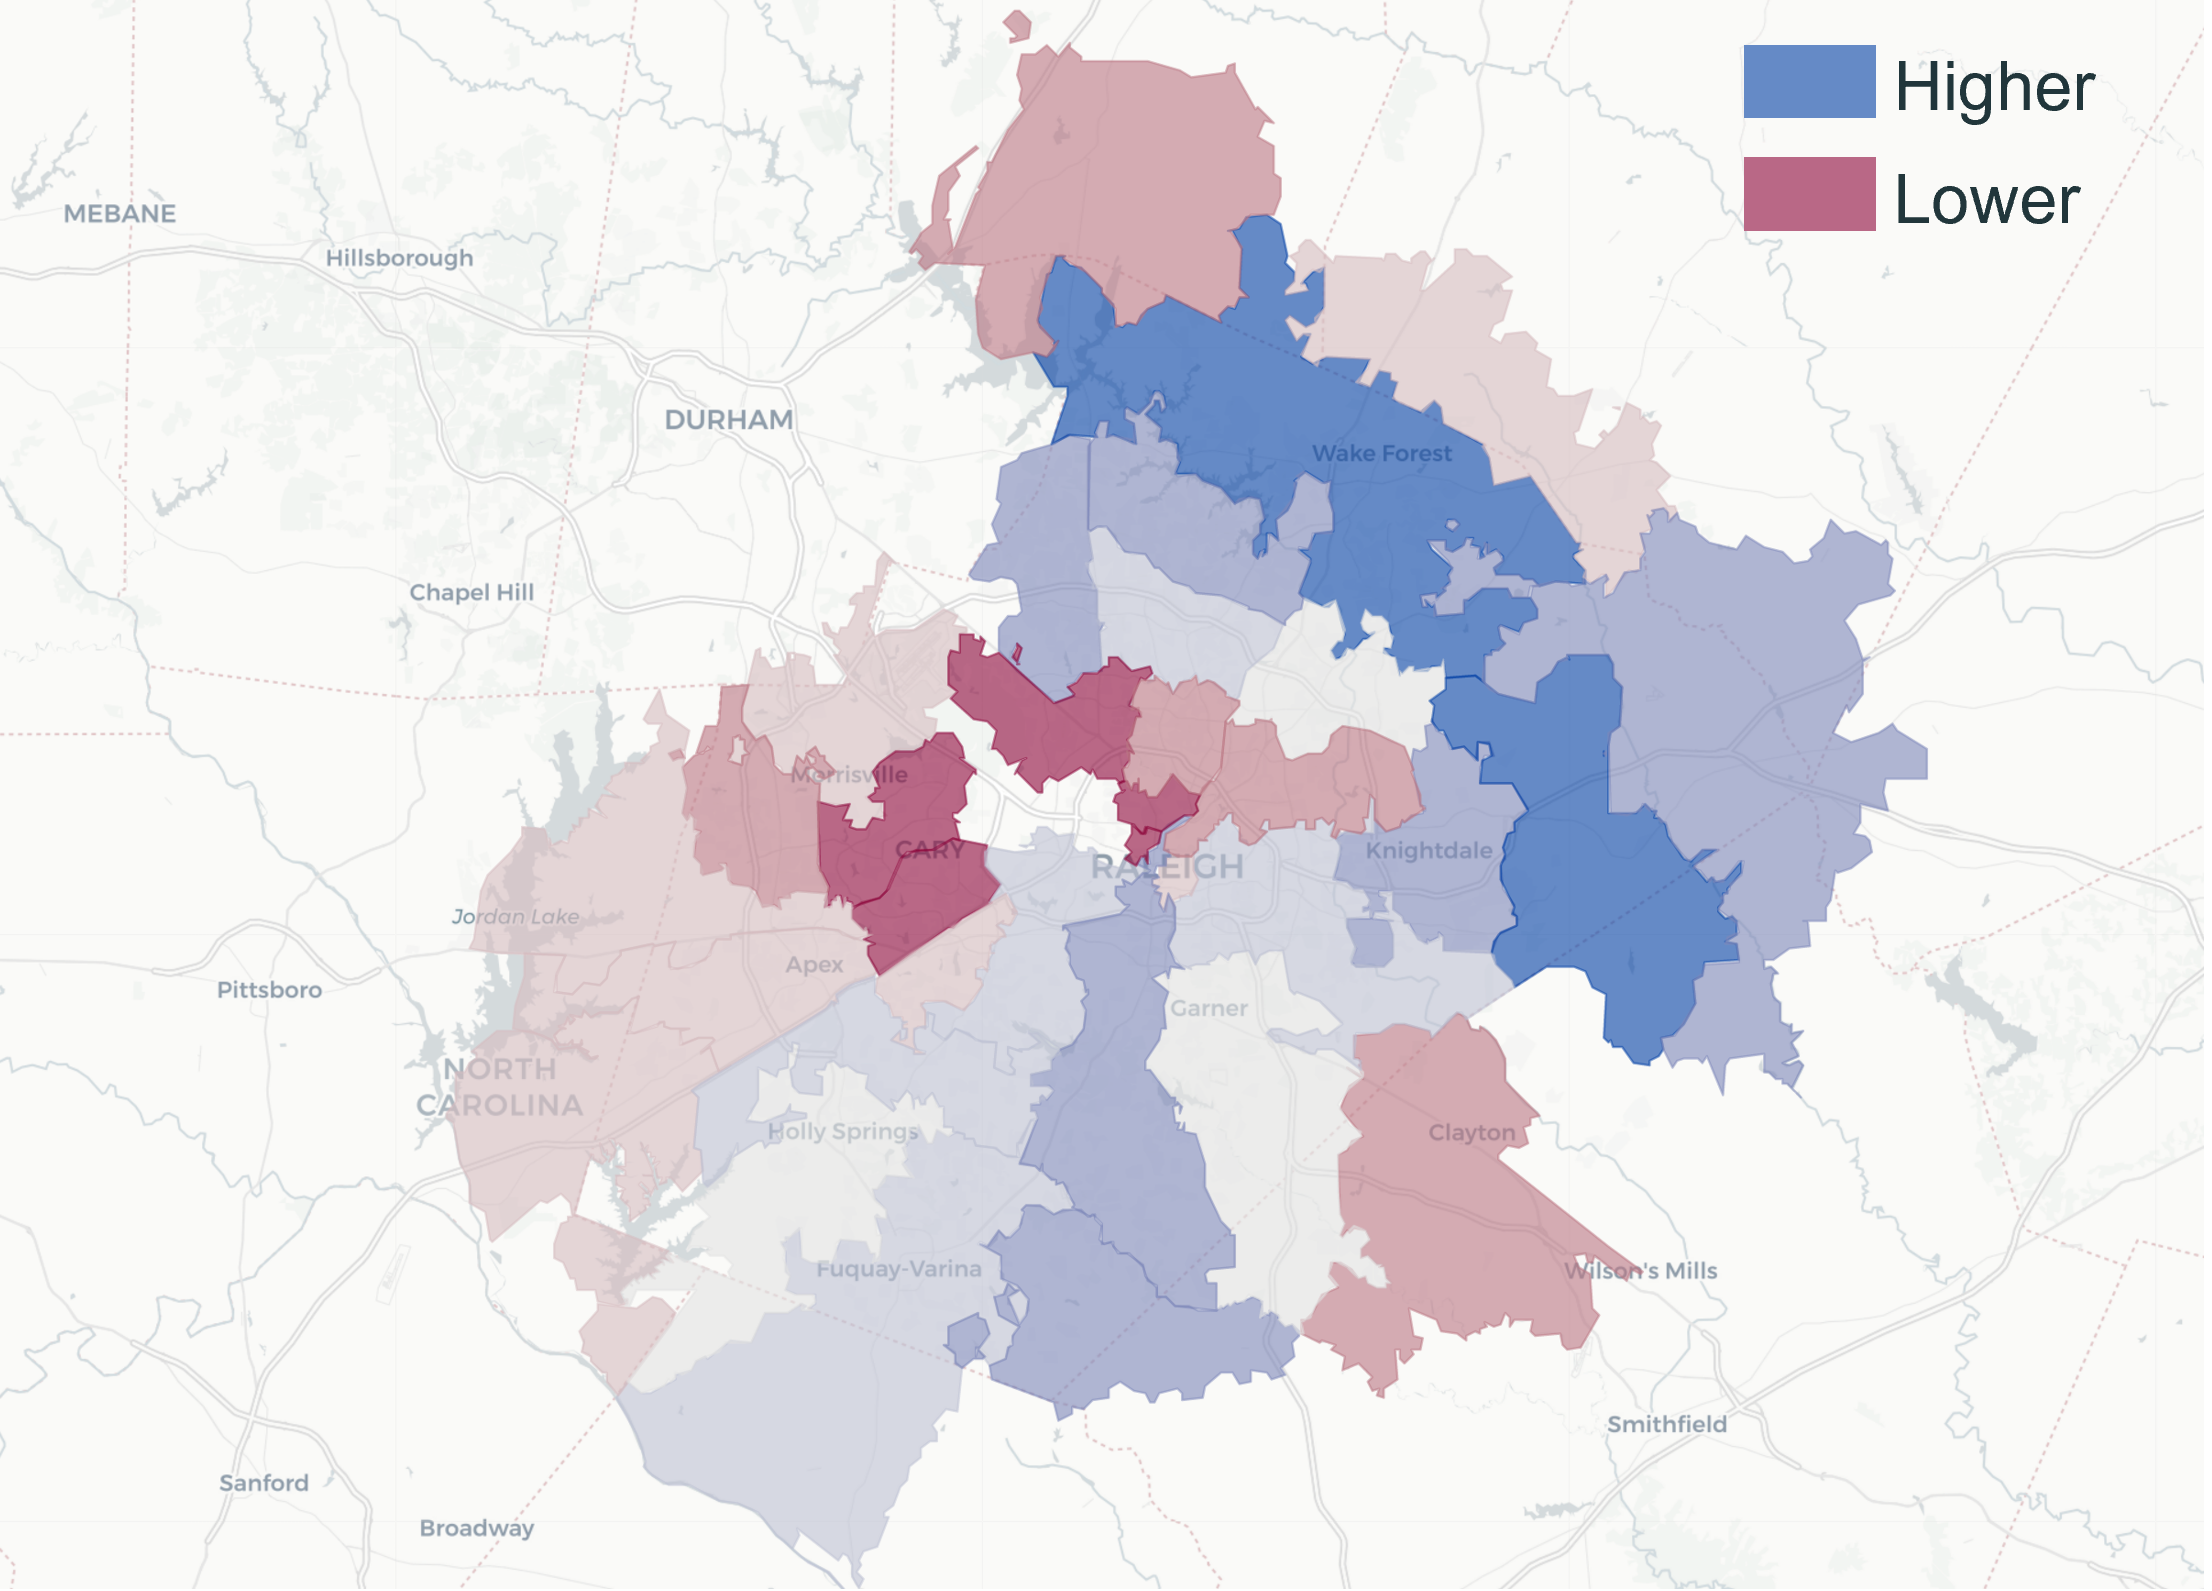
A business can serve a region - say, the Raleigh-Cary, NC Metro - but chances are the distribution of customers in that area isn’t equal. Using customer data, we can look for clear patterns in the zip codes, neighborhoods, or hotspots within a market where a business has higher success.
As an example, consider the below visualization with a hypothetical set of customer locations for a business. We can quickly identify the zip codes where this business has higher success - shaded in dark blue - and where there’s lower customer volume - areas shaded in darker red.
We can drill in a level further to get more specific on the areas with customer concentration.
In our darkest shaded zip code, we may find something like the below where we have a heatmap of locations that highlights some areas of higher concentration and other areas with gaps.

These maps & visualizations can lead to important conversations around sales, marketing, customer acquisition, operations, and growth strategy.
It might lead to questions like:
Why are we better at acquiring customers in some regions than others? Does this replicate to new areas?
Are we optimizing our operational footprint (i.e. are we storing our equipment as close as feasible to our customers)?
How do we fill in the gaps in the map?
When looking at customer locations, the pieces of information we typically look at are:
Are there geographic clusters where a business sees higher demand (adjusted for population size) or is it evenly distributed in a coverage area?
Has this been changing over time (Does the map look different 3 years ago versus today)?
Where are the gaps and why might they exist?
This gives the business a foundational knowledge of where they’ve been successful and helps them view their customer interactions at scale to see the patterns that emerge across a region.
Build Customer Profiles

When you know where a customer is, you can build profiles that describe the areas around where they live.
Are the areas with customer concentration higher income, middle income, or lower income? Are they more urban, suburban, or rural? Are they fast growing, near certain amenities, or have other identifiable characteristics?
To answer these questions, we generally follow a process that looks like:
Learn which areas have higher market share
Identify the data points that might be of relevance to the business (household income, population growth, age distribution of population, etc.)
Compare the relevant data points between areas that are higher share and lower share
Look for differences between high and low share areas
In our example above, we may conclude that areas shaded darker blue (higher concentration) are faster growing, middle income, and family-oriented while areas shaded darker red are higher income, established, and more urban.
This would suggest that our product or service is resonating with middle income families in fast-growing suburban regions.
From there, we can ask:
Does this match our vision of the target customer?
Is our marketing & branding aligned around this target customer?
If our branding and customer base is out of alignment, what’s the best corrective action?
This analysis helps companies create customer profiles, compare against existing profiles, and ensure alignment between branding & the target customer that’s being reached.
Develop Opportunity Zones and Track Progress
Combining the two analyses above leads us to identifying key growth opportunities for the business. Where are we not doing business today that has high potential for us?
The first analysis tells us where we’re doing well and where we have lower market share. The second analysis tells us the characteristics of the areas where we’re doing well.
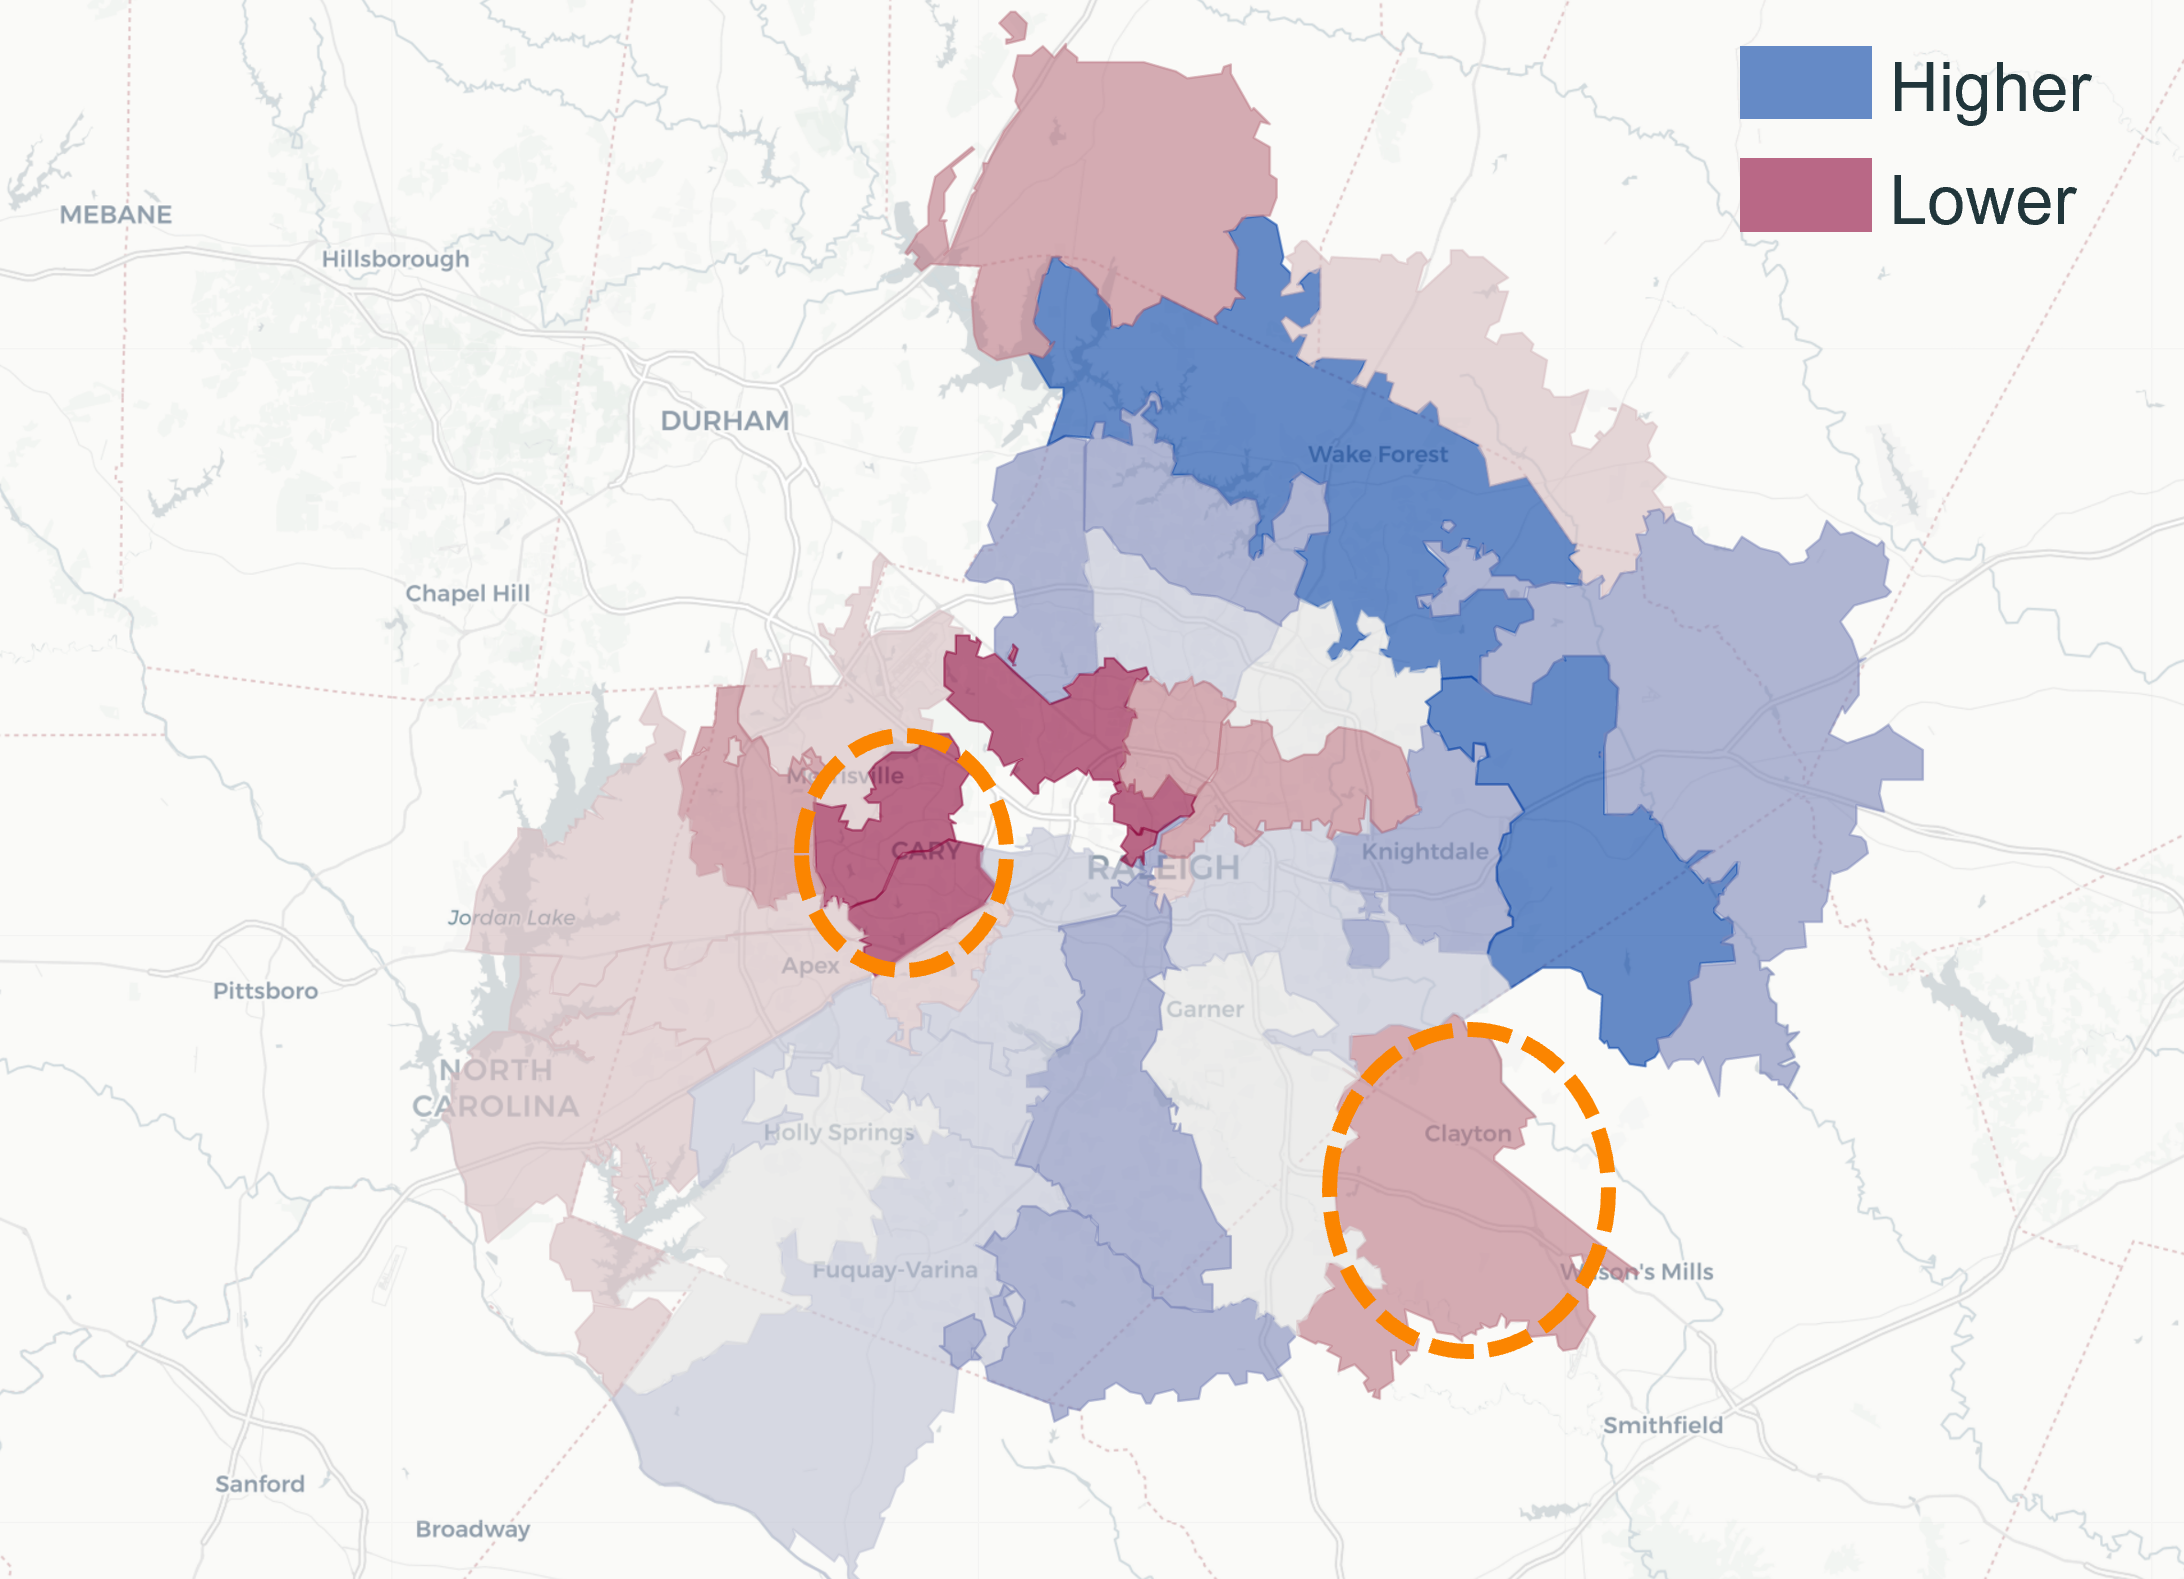
From there, we look at the areas within the coverage area that have our target characteristics but where we have low share.
The circled regions above have low customer volume but positive characteristics - family oriented, growing, middle or higher income. Why do we have low share? Is it competitive pressures? Awareness problems? Service area gaps?
This analysis helps us get targeted and specific in the opportunity that exists within the market. Where should a business focus their time, attention, and marketing dollars? Which areas have the highest potential for growth?
We can also track progress over time - if we set up a series of initiatives to grow in these zip codes, we can look at whether those regions are growing faster than their previous benchmarks.
Final Thoughts
Businesses that have a location component to their product or service - and that have been collecting & storing that information - have an advantage over traditional retail businesses when it comes to understanding their target customer and growth opportunities.
These businesses can learn exactly where their product & message is resonating, the characteristics of those areas, and the other areas where they can continue to pursue growth.
These analyses generate clear insights on the state of the business today, the growth opportunities moving forward, and the customers that’s using the product or service.
Interested in how this might apply to your business? Reach out to us through our website or by email at jordan@bean.consulting to learn more.