
Data-Driven Growth: Analyzing a Market for High-Potential Hotspots

Moving into a new or unfamiliar city, county, or metro presents a problem for businesses - How do they know which part of the market is best for their business to acquire, stand up a location, pursue customers, or focus marketing efforts?
Without local experience or expertise, companies are left guessing which areas have product-market fit for them. Data brings more conviction to the decisions and questions around market growth.
Identifying hot spots for a company typically means looking at the intersection of data points - areas that match multiple criteria, for example market size and household income and high workforce and …
Each data point in isolation helps us understand how residents and workers distribute in a market, and looking at them collectively helps us surface areas of high relevance for a business.
We follow a simple framework for surfacing hot spots in a market:
-
What needs to be in place for the business to be successful? A large population size? Higher household income? A specific business type like a hospital or elementary school?
-
Which factors are critical and which are nice to have? How much more important is a higher household income compared to market size? We look to set up a scoring system that best reflects not just the important data points, but how important they are.
-
We find the available data, prepare it into the right format, score and rank our geographies, then visualize it on a map to drive spatial insights.
When this framework is applied, it results in a roadmap for the areas in a market that hold higher potential for a business, like the representative map on the right for a business moving into Raleigh-Durham (southwest is better, northwest is worse for the applied scoring formula).
With this framework, a business knows where to look, why to look there, and has conviction that the area has the right characteristics for their product or service to succeed.
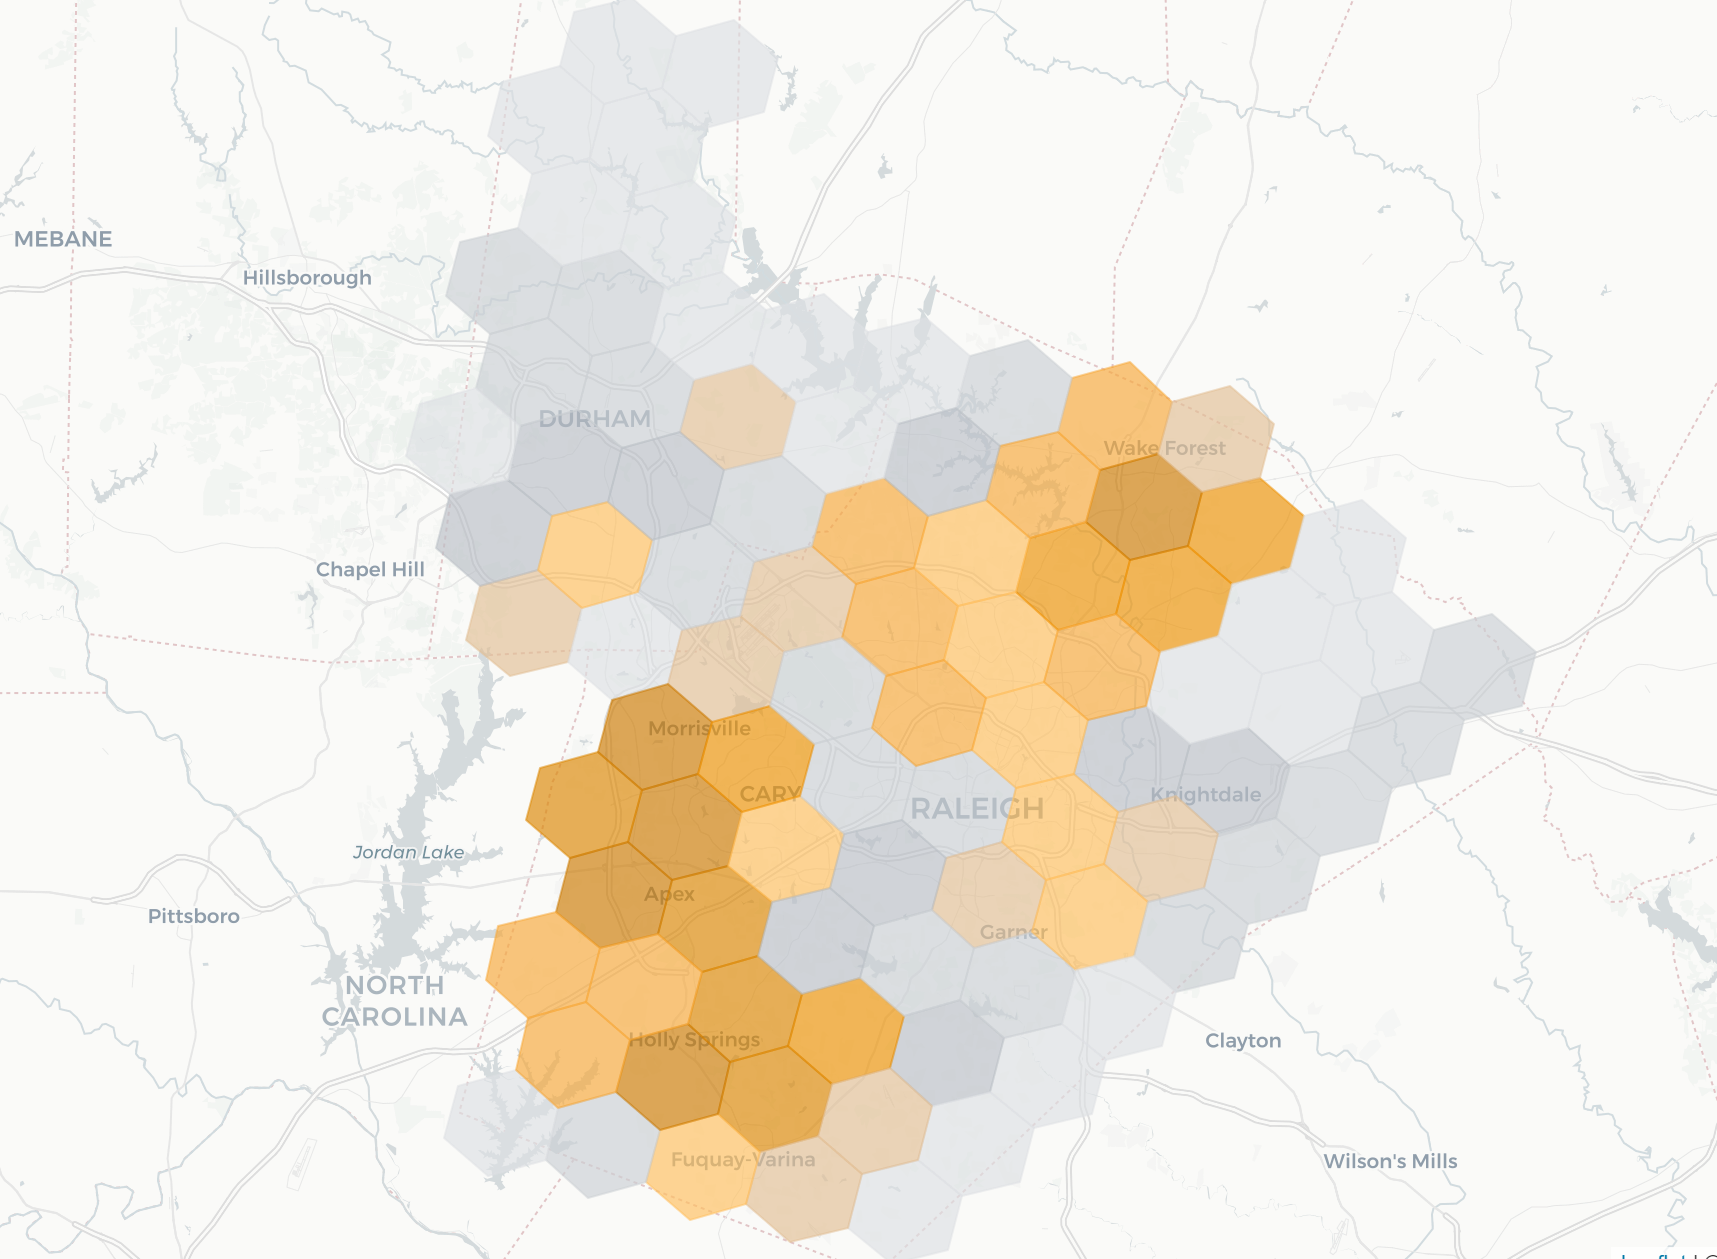
Representative market map in Raleigh-Durham, North Carolina
Our Data-Driven Approach
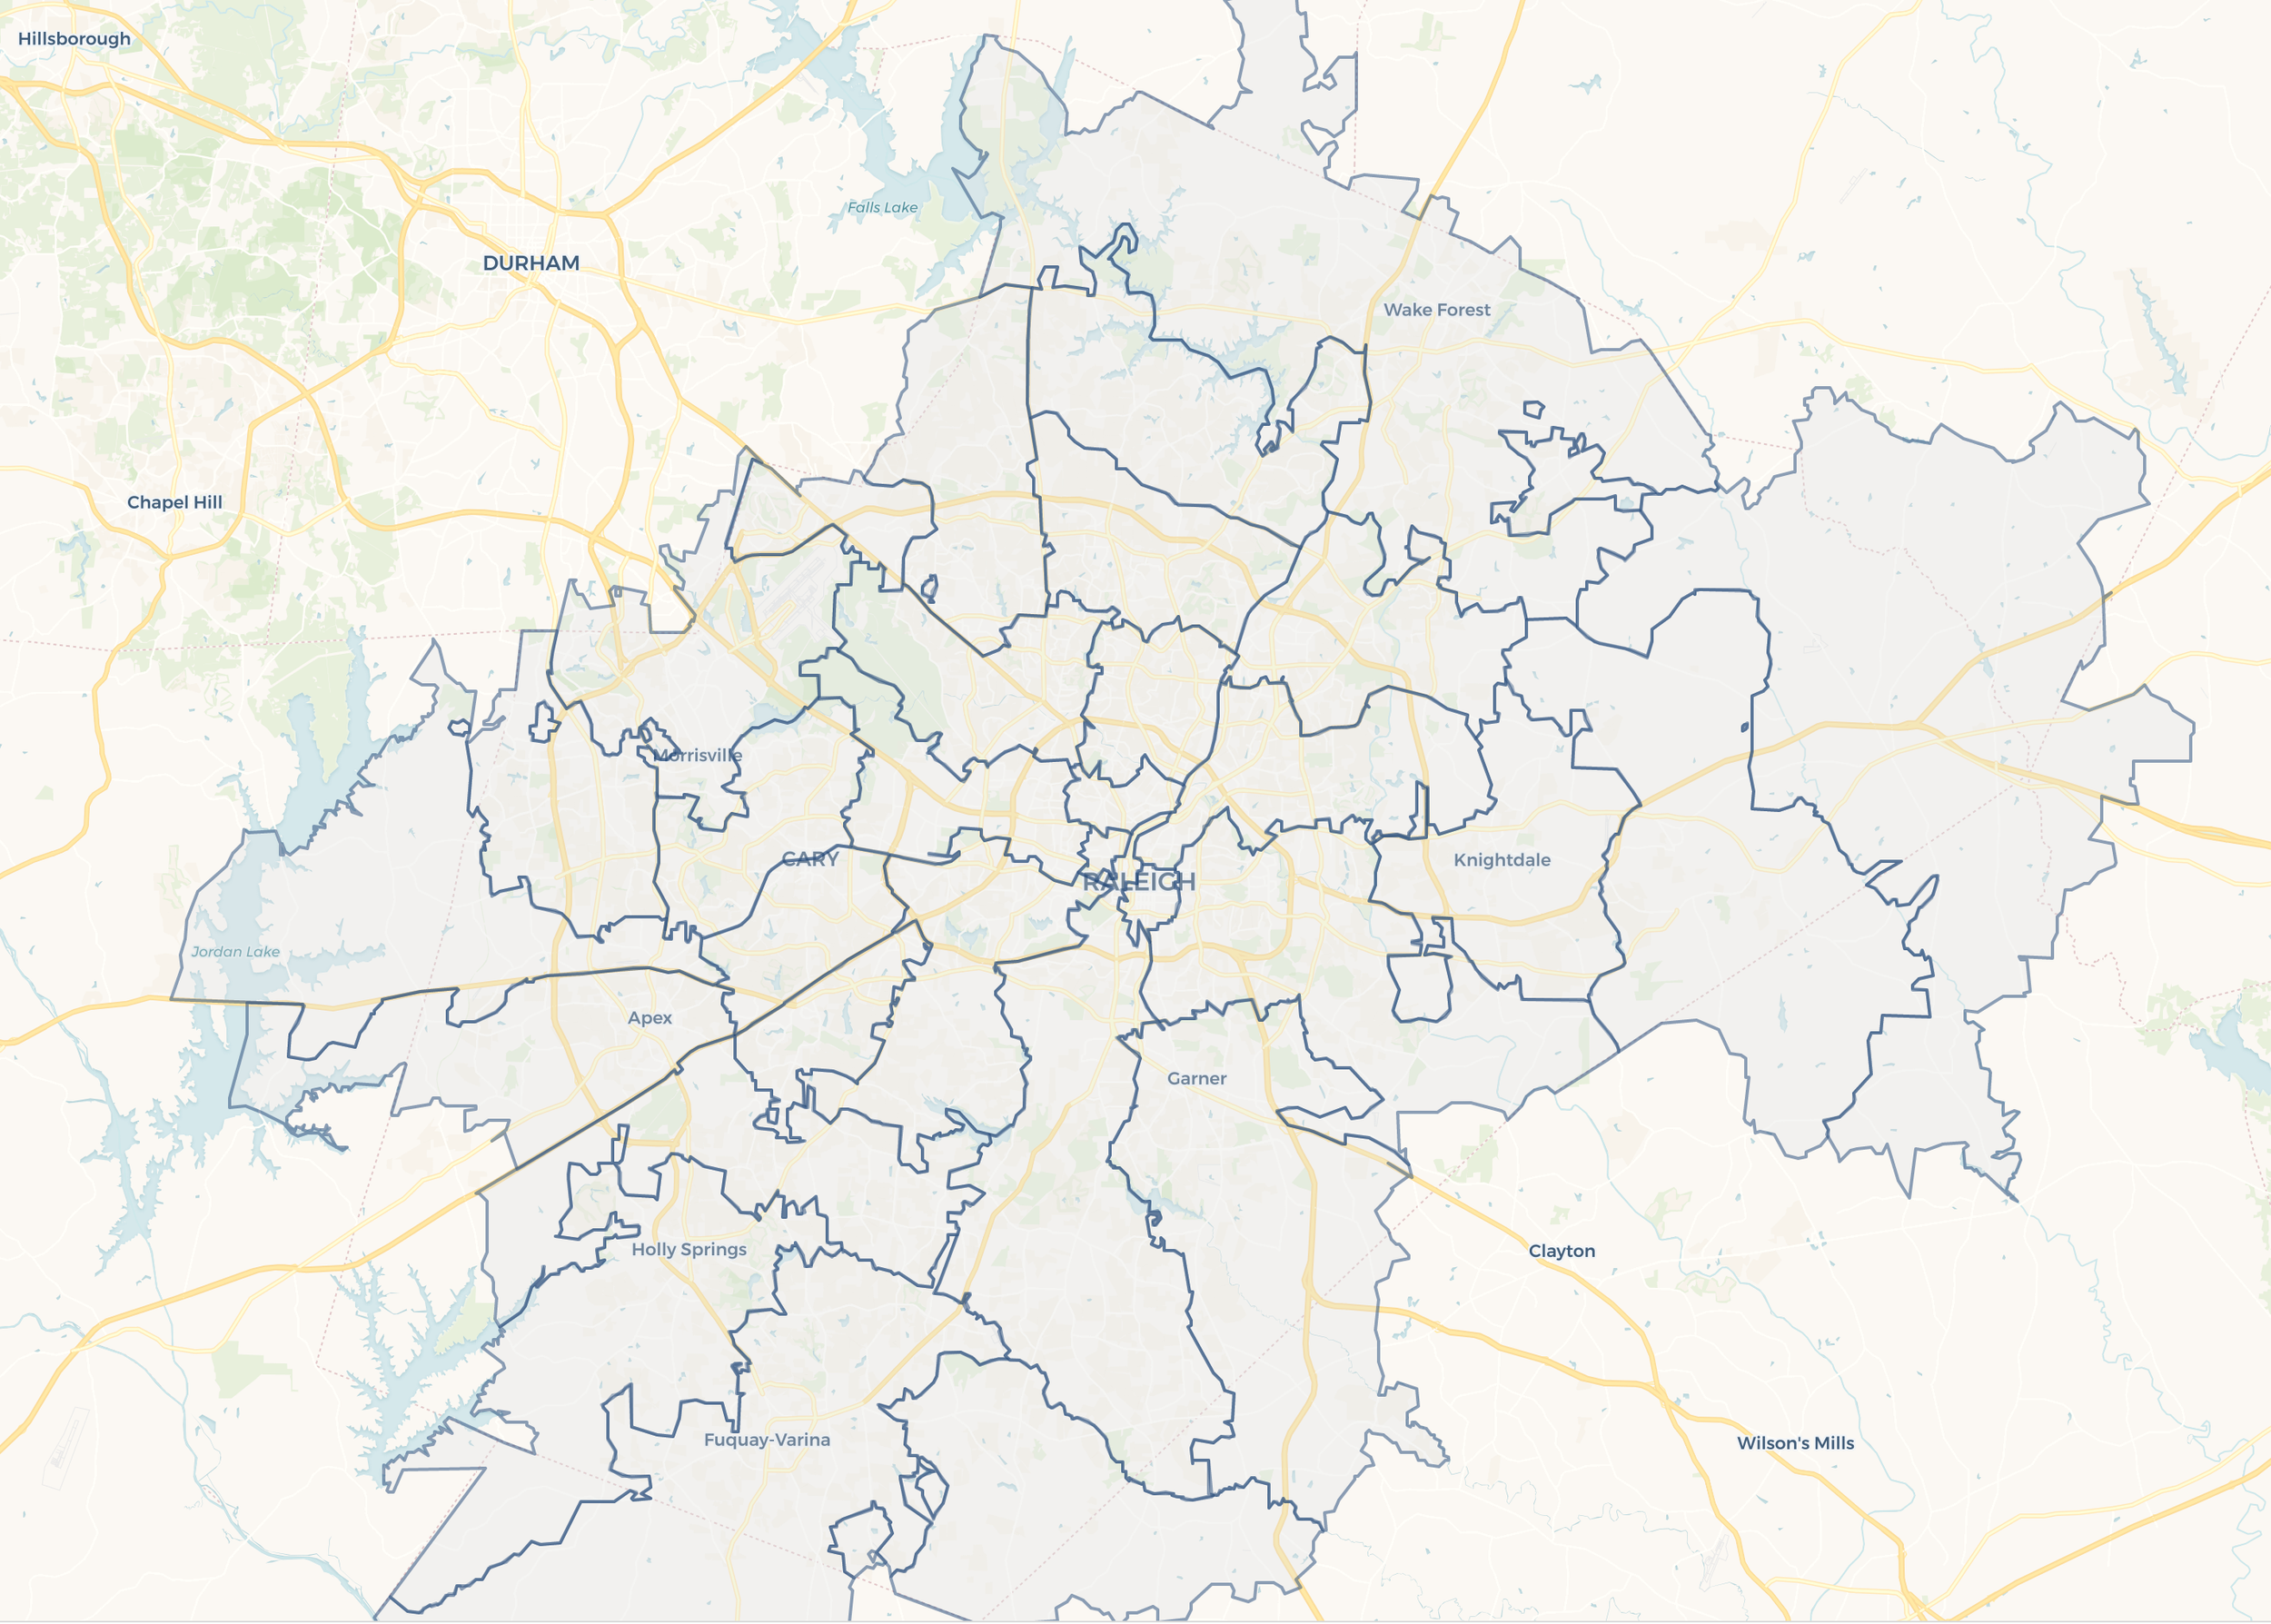
Before jumping into the framework, we start by determining the right level of geography to break down a market into smaller parts. We typically go one of two routes: zip codes or hexagons.
Zip codes are recognizable, commonly used in data reporting, and present easy identifiers for market segmentation.
However, the biggest drawback is that they are unequally sized. Zip codes in urban areas are smaller and in more rural parts of the county are larger. The sizes have no rhyme or reason. They are a function of mail delivery for the USPS, not statistical reporting.
This can make comparisons across areas challenging, or within a zip code we may see notable differences that don’t come through in market analysis.
Hexagons benefit from being equal-sized, adaptable (we can shrink or increase the size of the hexagons), and better representations of point-of-interest data (addresses / specific locations).
Their downside is that nearly no data reporting happens at these boundaries, meaning we need an accurate way to convert reporting at traditional boundaries to hexagons.
This is possible, but only when data can be sourced at more granular levels of detail than zip codes and/or the data is tied to specific addresses.
Wake County Zip Codes

Wake County Equal-Sized Hexagons
Ultimately, we tend to use zip codes when:
The data available cannot be sourced at more granular levels
It aligns with a company’s internal reporting & segmentation
We use hexagons when:
There are specific locations available
Precision matters
There will not be internal reporting built around the output
The selection of how we represent a market feeds into our data sourcing, market mapping, and ultimately how we generate the hotspots for an area.
With that, let’s jump into our framework.

1. Define Success Metrics
Many businesses have a target market or a specific type of customer that uses their product.
For example, a pediatric dentist may benefit from being near families, K-12 schools, and a growing population. A fast-casual, upscale restaurant chain may want to be around white collar professionals, high-earning households, and in high-density areas. A senior living facility or services may target areas with a higher percentage of the population over 55.
Defining success metrics means describing a target area in a way that can be translated into numbers
To find hot spots in a market, we need to define what we’re looking for and answer: What makes one area better or worse than another?
The description doesn’t need to be complicated, it just needs to be representative of the target market a business is trying to reach. We find that many businesses are able to come up with strong profiles with some combination of:
Population size, age, and growth
Number of jobs and/or employment
Level of income
Household composition (families, households with children, etc.)
Complimentary points of interest
Competition
For a provider of services to families & younger children, this could look something like:
We target areas that have high population, are middle to upper-middle income, are family-oriented, with nearby schools or other family amenities.
This type of statement can be converted to data then searched for in a market.
2. Determine the Criteria’s Relative Importance

Not all data points are created equal.
To find hotspots, we need to know both the metrics for success and how important each metric is. Some will be critical, and others nice-to-have. They shouldn’t be treated equally.
By doing so, we create a “weight” for each variable that assigns it a relative importance. These weights are interpretable, flexible, and contribute to the final scoring.
In the example to the left, this weighting would imply that the percentage of households with families is critical to success and is 3x as important as population size.
The weightings are as much art as science - they reflect how a business views its target market and ultimately will be directionally correct. We typically try a couple different weightings, see how the results change, and see areas that surface across different weightings.
3. Source, Score, and Visualize the Data
The final stage is to bring together all the above into interpretable visuals - transforming raw numbers to insights.

We line up the success metrics in each level of geography (zip code or hexagon), compare the geographies based on our weighting, and look for spatial trends in the market.
When visualized, we look for clusters of high-scoring areas. This suggests a strong broader area rather than a single smaller bright spot.
The result is a clear visualization of the areas within a market where the business is more likely to find success given the success metrics of their business.
In the visual to the right, we can conclude that the areas in the southwest and north central/east hold higher potential for the business (the places with darker orange).
This information can now be used for acquisition screening, location scouting, marketing initiatives, or other business development.
Rather than saying “We’re going to enter this market” we can now say “We’re going to enter this market and focus on these specific areas” which leads to a higher probability of success than treating all parts of a market equally.
Data in Action
Let’s look at some examples of how shifting the target market and variables affects where we focus in a market. Note how there’s overlap across maps in some areas that consistently light up orange (higher score), but also new areas that emerge depending on how we tweak the key variables.

Situation 1: Pediatric Dentist Group
Target Market: Suburban areas with higher population size, nearby K-12 enrollment, higher presence of families, and a growing population
Results: The southwest and north east / central areas of Wake and Durham counties present the strongest opportunity.
Situation 2: Fast-casual chain with expensive healthy bowls
Target Market: Urban areas with mixed residential population and workforce, and upper-middle class income.
Results: Central Raleigh, west toward Cary, Morrisville, and Apex show the strongest opportunity.
Situation 3: Mass Appeal Product (i.e. Residential & Commercial HVAC provider)
Target Market: Large residential and employment market size with a growing population.
Results: Central Raleigh moving southwest; downtown Durham and surrounding area.
Data doesn’t guarantee success, but it ensures that a company is looking in the right places given their product and target market. All areas are not created equal, and the right data & analytics points us in the direction that makes the most sense for the business.
Think this type of analysis would be helpful for your business? Reach out to us on our Contact page or by email at jordan@bean.consulting to discuss further.